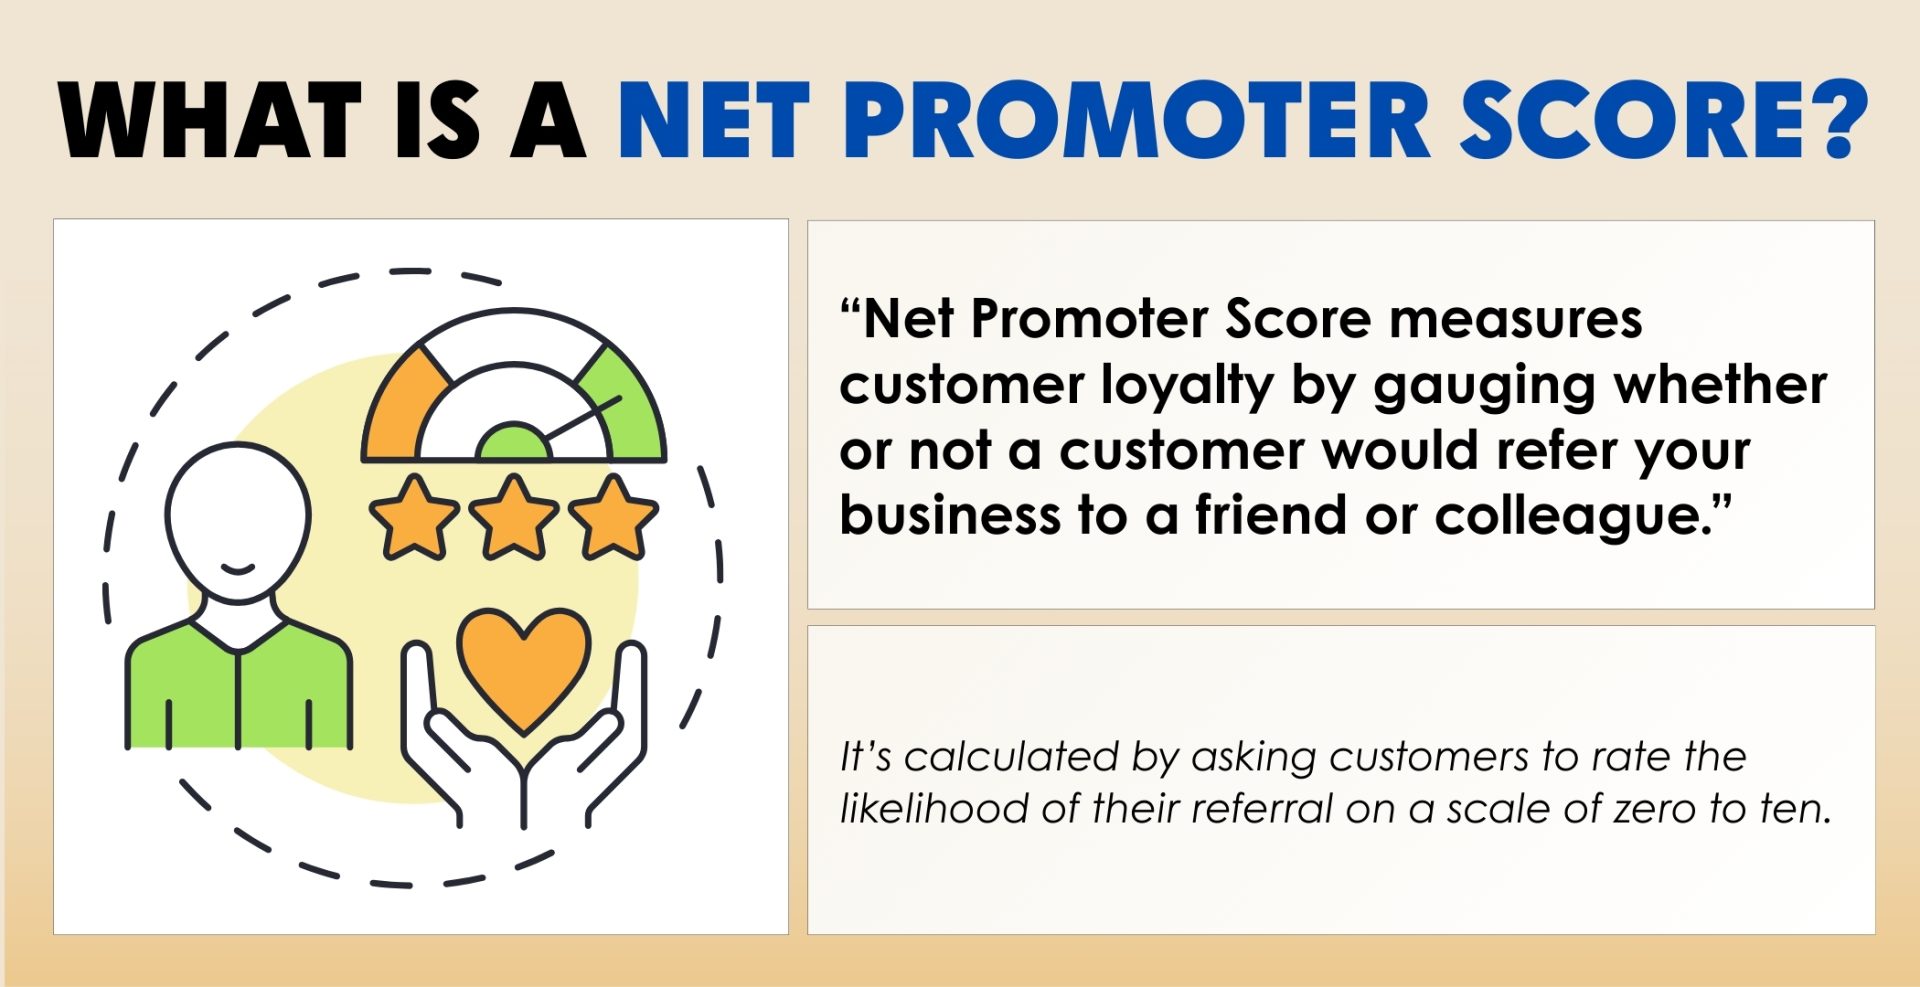
Introduction:
Envision a situation where you can comprehend your customers’ feelings before they even speak to you. Imagine identifying discontent, recognising loyalty patterns, and knowing precisely the exact time to act in order to maintain customer satisfaction.
This is the capability of predicting Net Promoter Score (NPS), which turns the wheel from reactive support to proactive success. It’s no longer sufficient to wait solely for customers’ feedback today. It is the Businesses that foresee customer sentiment that turn insights into tangible, measurable results.

Understanding the NPS Survey Design
Many surveys have a split personality due to a lack of clear design goals. We focus on eliminating ineffective processes and poor survey frameworks. Our team can help your organization ask the right questions to the right audience at the right time through the proper technique to help you understand your promoters and detractors with increased clarity.
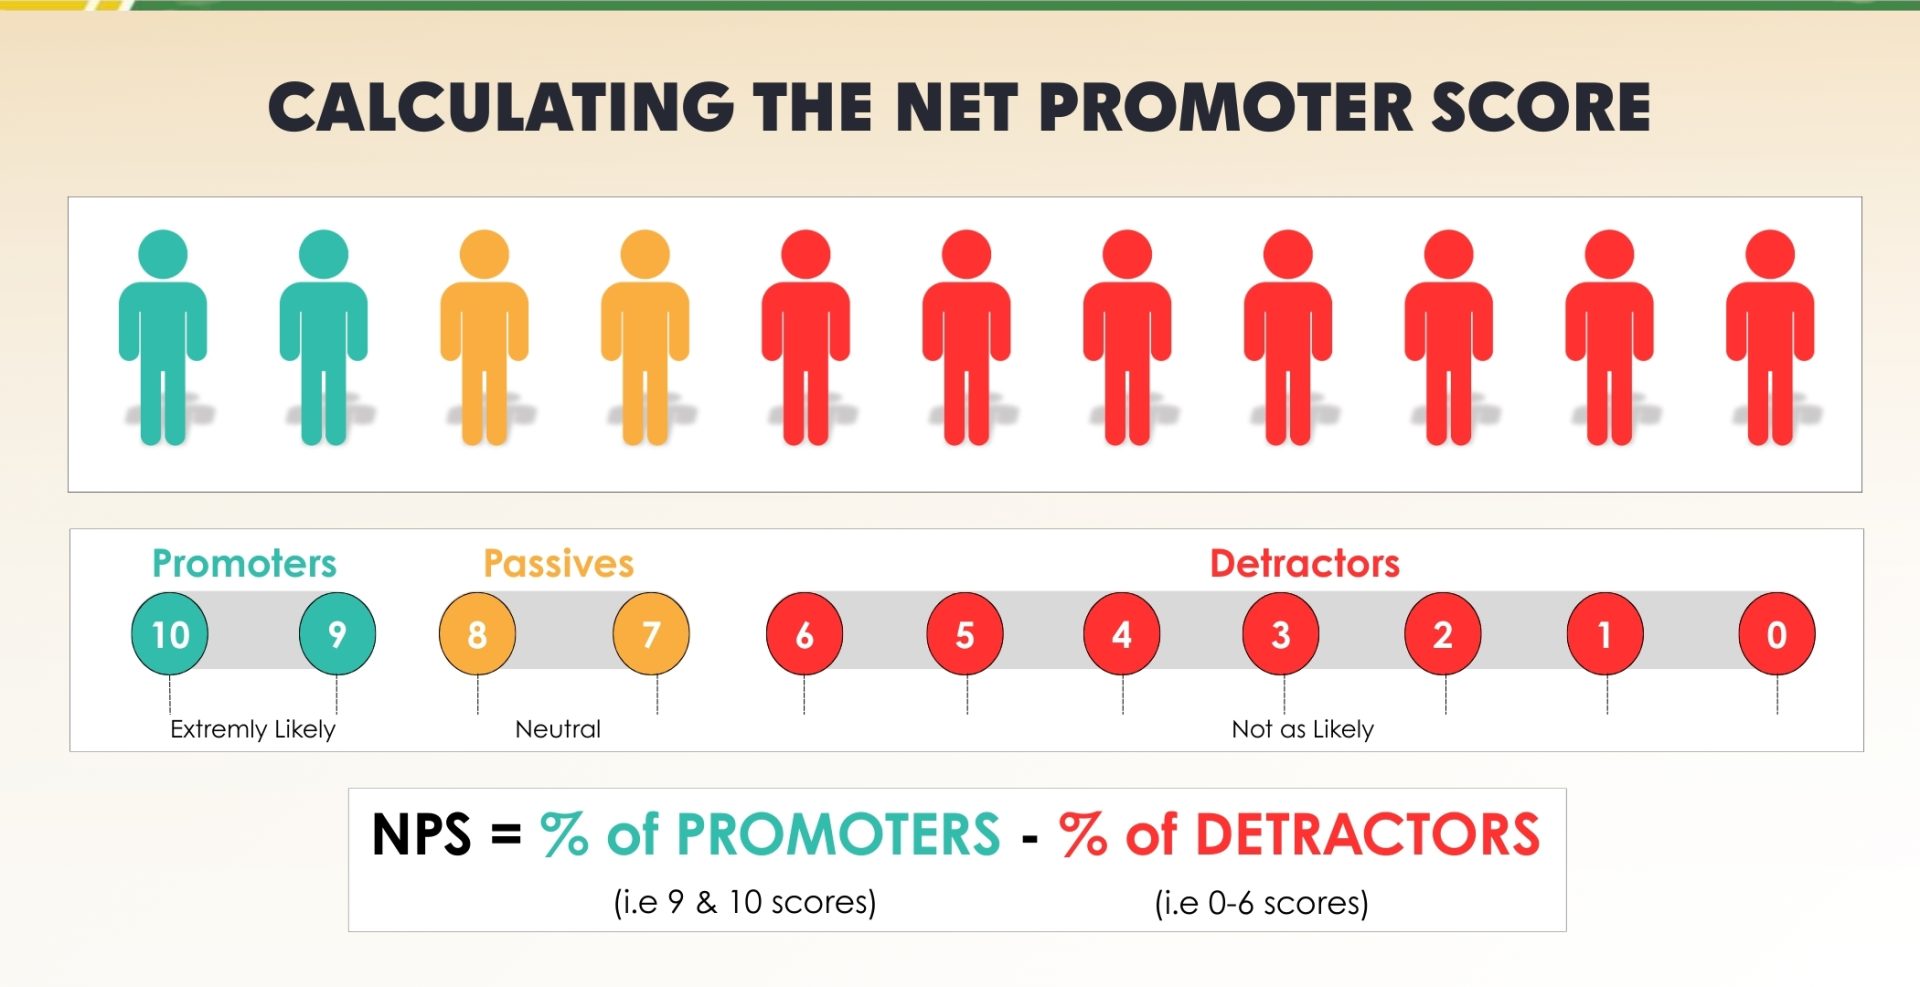
How to Calculate Net Promotor Score

The method of NPS Deployment
Deployment of surveys is more than just a set of questions for consumers to respond to. Gathering meaningful information that reflects accurate customer perception about your service is an art. Each survey is unique, with requirements specific to its target audience. Customer Surveys and Market Research Surveys are most economically accomplished with online surveys. The need for paper or telephone surveys in the last few years has been eliminated with proper sampling techniques.
Bill Gosling Deployment services are designed to implement end-to-end net promoter methodology effectively and effortlessly. With over 5 million responses, we have helped organizations across industries and of various sizes to effectively skyrocket their business metrics.
What is a good Net Promoter Score?
There is no set of rules for a good Net Promoter Score; it differs significantly by industry. However, a generally acceptable number is:
- Excellent NPS: 50+
- Good NPS: 30-49
- Average NPS: 0-29
- Poor NPS: Below 0
As mentioned in the Surveymonkey’s article Benefits of Net Promoter Score (NPS): Pros, cons, and best practices – a notable example of a non-uniform acceptable number is the industry average NPS for insurance companies, which is 71, whereas for healthcare, it is 38, significantly lower[i].
Fixing the Gaps, winning customer- Conquering NPS Improvement
Improving your Net Promoter Score (NPS) is not limited to just achieving a good number. Enhancing NPS should focus on establishing a brand that is loved, trusted and recommended by your customers. An increasing NPS represents thoughtful relationships, proactive support and consistent experiences. However, achieving this desired result requires more than just surveys and follow-up emails. It demands working actively on customer feedback, determining root causes, and forming a customer journey that turns customers into brand advocates.
1. Survey Structure Assessment: Identify the Big “Y” Behind NPS
Designing the survey is initiated by disclosing the “Big Y”. The primary results or insights that the survey is being prepared for like customer satisfaction, service quality. This concerns assessing whether his concerns assessing whether the questions align with the major goal of estimating customer experience and loyalty. The main focus is on service quality-related questions to confirm they feed meaningfully into the NPS model.
2. NPS Performance Review: Understanding the Baseline
The current NPS performance is evaluated by separating the division of We assess your current NPS performance by breaking down the Promoters (9–10), Passives (7–8), and Detractors (0–6). This assists in determining sentiment trends, the missing pieces in customer satisfaction and the requirement of intervention. Benchmarking as per industry standards is also enabled.
3. Key Driver Analysis (KDA)
Our team will analyze if the questions in the survey are related to each other as well as to the NPS question.
4. Correlation of NPS and business objectives
Through regression techniques, our team will study the relation between NPS and other business metrics like conversion, retention, turnaround time, cycle time, etc.
5. Study of Big Y’s:
Arriving on Big “Y’s” that drives NPS using statistical tools like multivariate analysis. This method, with the help of data, identifies the priorities of your customers, whether it’s the response time, first-contact resolution, or tailored services
6. Drivers of NPS
Identify the factors having the highest impact on overall NPS. This insight is essential for streamlining initiatives that will deliver highest returns in NPS improvement.
7. Performance of NPS Drivers
Understand factors impacting overall NPS. This evaluation of gaps assists in comprehending where customer expectations are fulfilled and where they are lacking.
The analytical capability of Bill Gosling Outsourcing is the secret sauce to creating a seamless customer experience in the digital world. Through a sophisticated set of analytical services spanning across the spectrum from big data consulting to support and managed services, we help you generate relevant and actionable insights. We work with the greatest brands to boost their data and analytical capabilities.
Did You Know? According to Bain & Company, companies with the highest NPS in their industry grow at more than twice the rate of their competitors.
Benefits of NPS Improvement
- Knowing the Consumer Better: Generate values that strengthen your brand, attracts and retain customers,
- Driving Process Excellence: Bridging gaps, reducing waste and inefficiencies by sharing data and insights,
- Improving Decision-making: Stepping up to a more predictive decision-making approach.
Wrap up
A reactive-to-proactive approach is given to a company by Predicting NPS. This approach enables the company to predict customers’ behaviour, reduce churn, and customize the experience. By the blending of historical data, behavioural scoring, and AI-driven models, the root causes behind customers’ behaviour are revealed and convert anger into contentment.
Frequently Asked Questions About Predictive NPS and Customer Success
1. What is Predictive NPS?
Predictive Net Promoter Score (NPS) leverages data analytics and machine learning to forecast future customer sentiment. By analyzing patterns in customer behavior, interactions, and feedback, businesses can anticipate whether customers are likely to become promoters, passives, or detractors.
2. How does Predictive NPS enhance customer success strategies?
By forecasting customer sentiment, businesses can:
- Proactively address potential issues before they escalate.
- Identify opportunities for upselling or cross-selling to promoters.
- Tailor engagement strategies to different customer segments.
- Allocate resources more effectively to areas with the greatest impact.
3. What industries benefit most from Predictive NPS?
Industries with high customer interaction and complex journeys—such as telecom, SaaS, utilities, banking, and retail—tend to benefit the most from predictive NPS models. These sectors can leverage predictive insights to improve customer retention and satisfaction.
4. How can businesses implement Predictive NPS?
To implement predictive NPS, businesses should:
- Collect and integrate data from various customer touchpoints.
- Utilize machine learning algorithms to analyze customer behavior.
- Regularly update models to reflect changing customer preferences.
- Act on insights by adjusting customer success strategies accordingly.
5. What are the potential challenges of Predictive NPS?
Challenges include:
- Data privacy concerns and ensuring compliance with regulations.
- Maintaining data quality and accuracy.
- Integrating predictive models with existing customer success platforms.
- Ensuring that insights lead to actionable outcomes rather than just awareness.


